Article
Australia Recovers Two-Thirds of Its Waste; Metals Lead at 90%.
Key Takeaways :
- Australia’s resource recovery rate has surged from 49% to 66% since 2006-07.
- Metals recorded an 89.9% recovery rate, the highest of any material category.
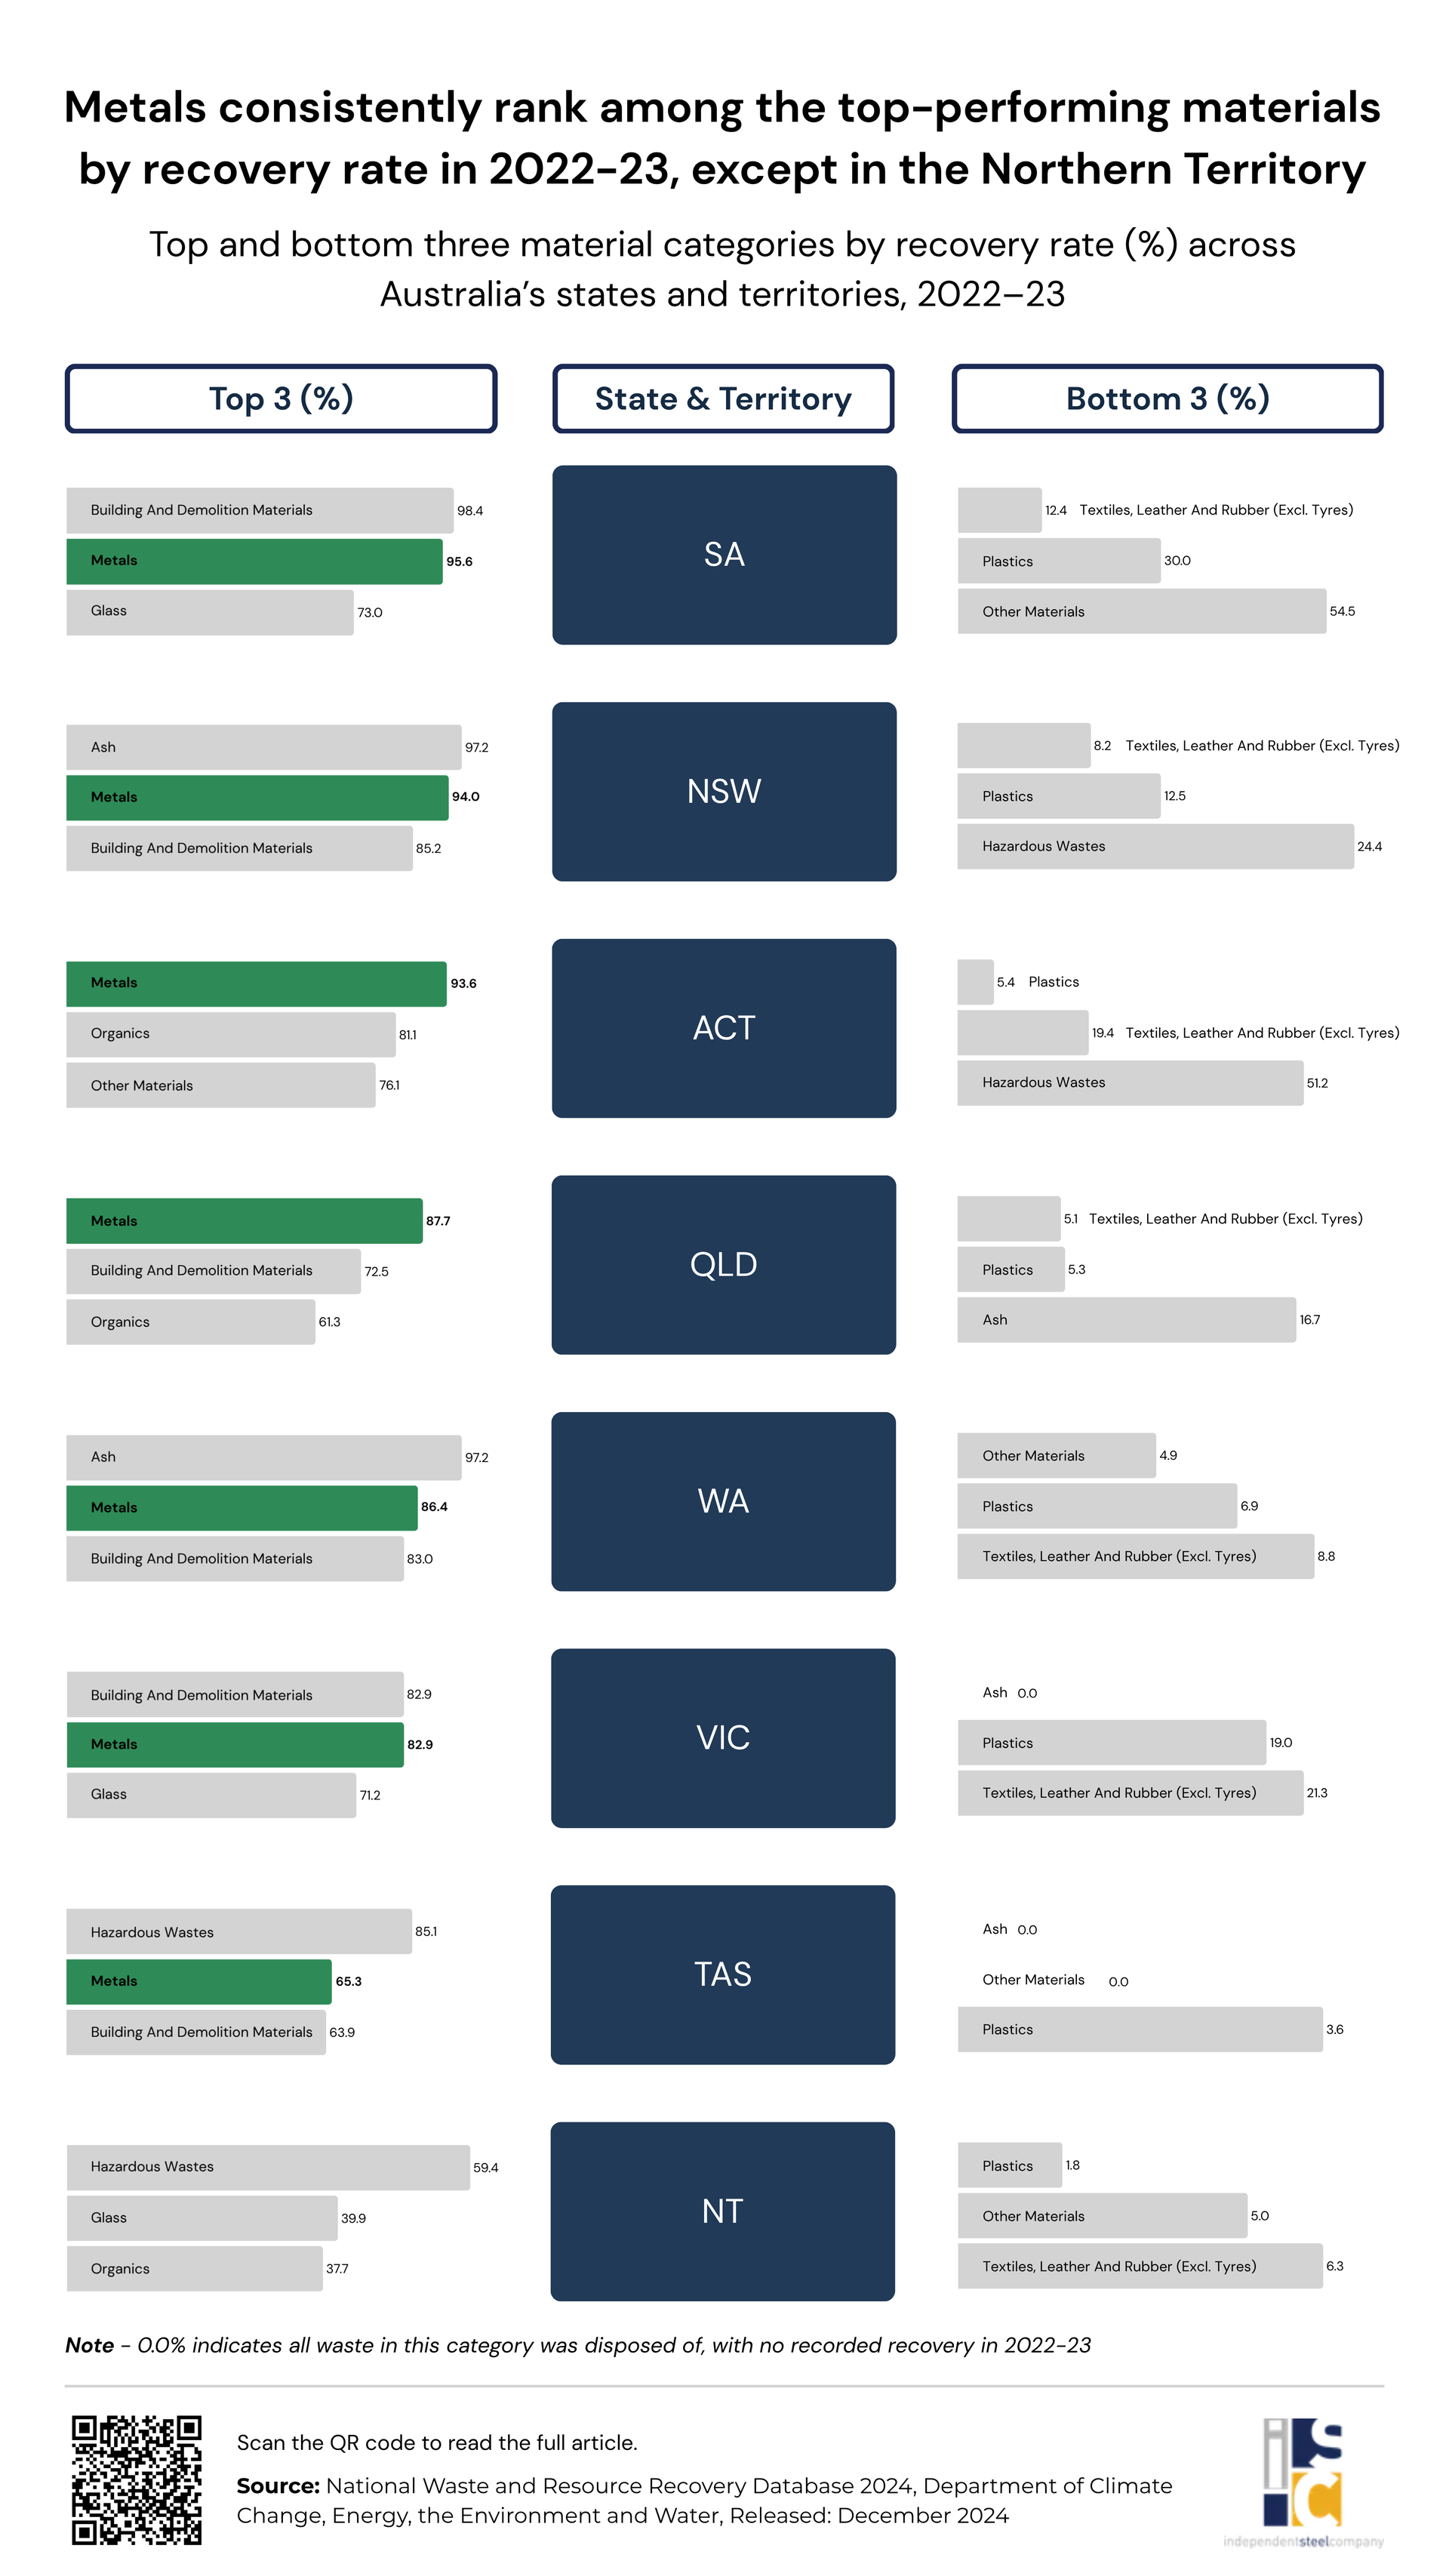
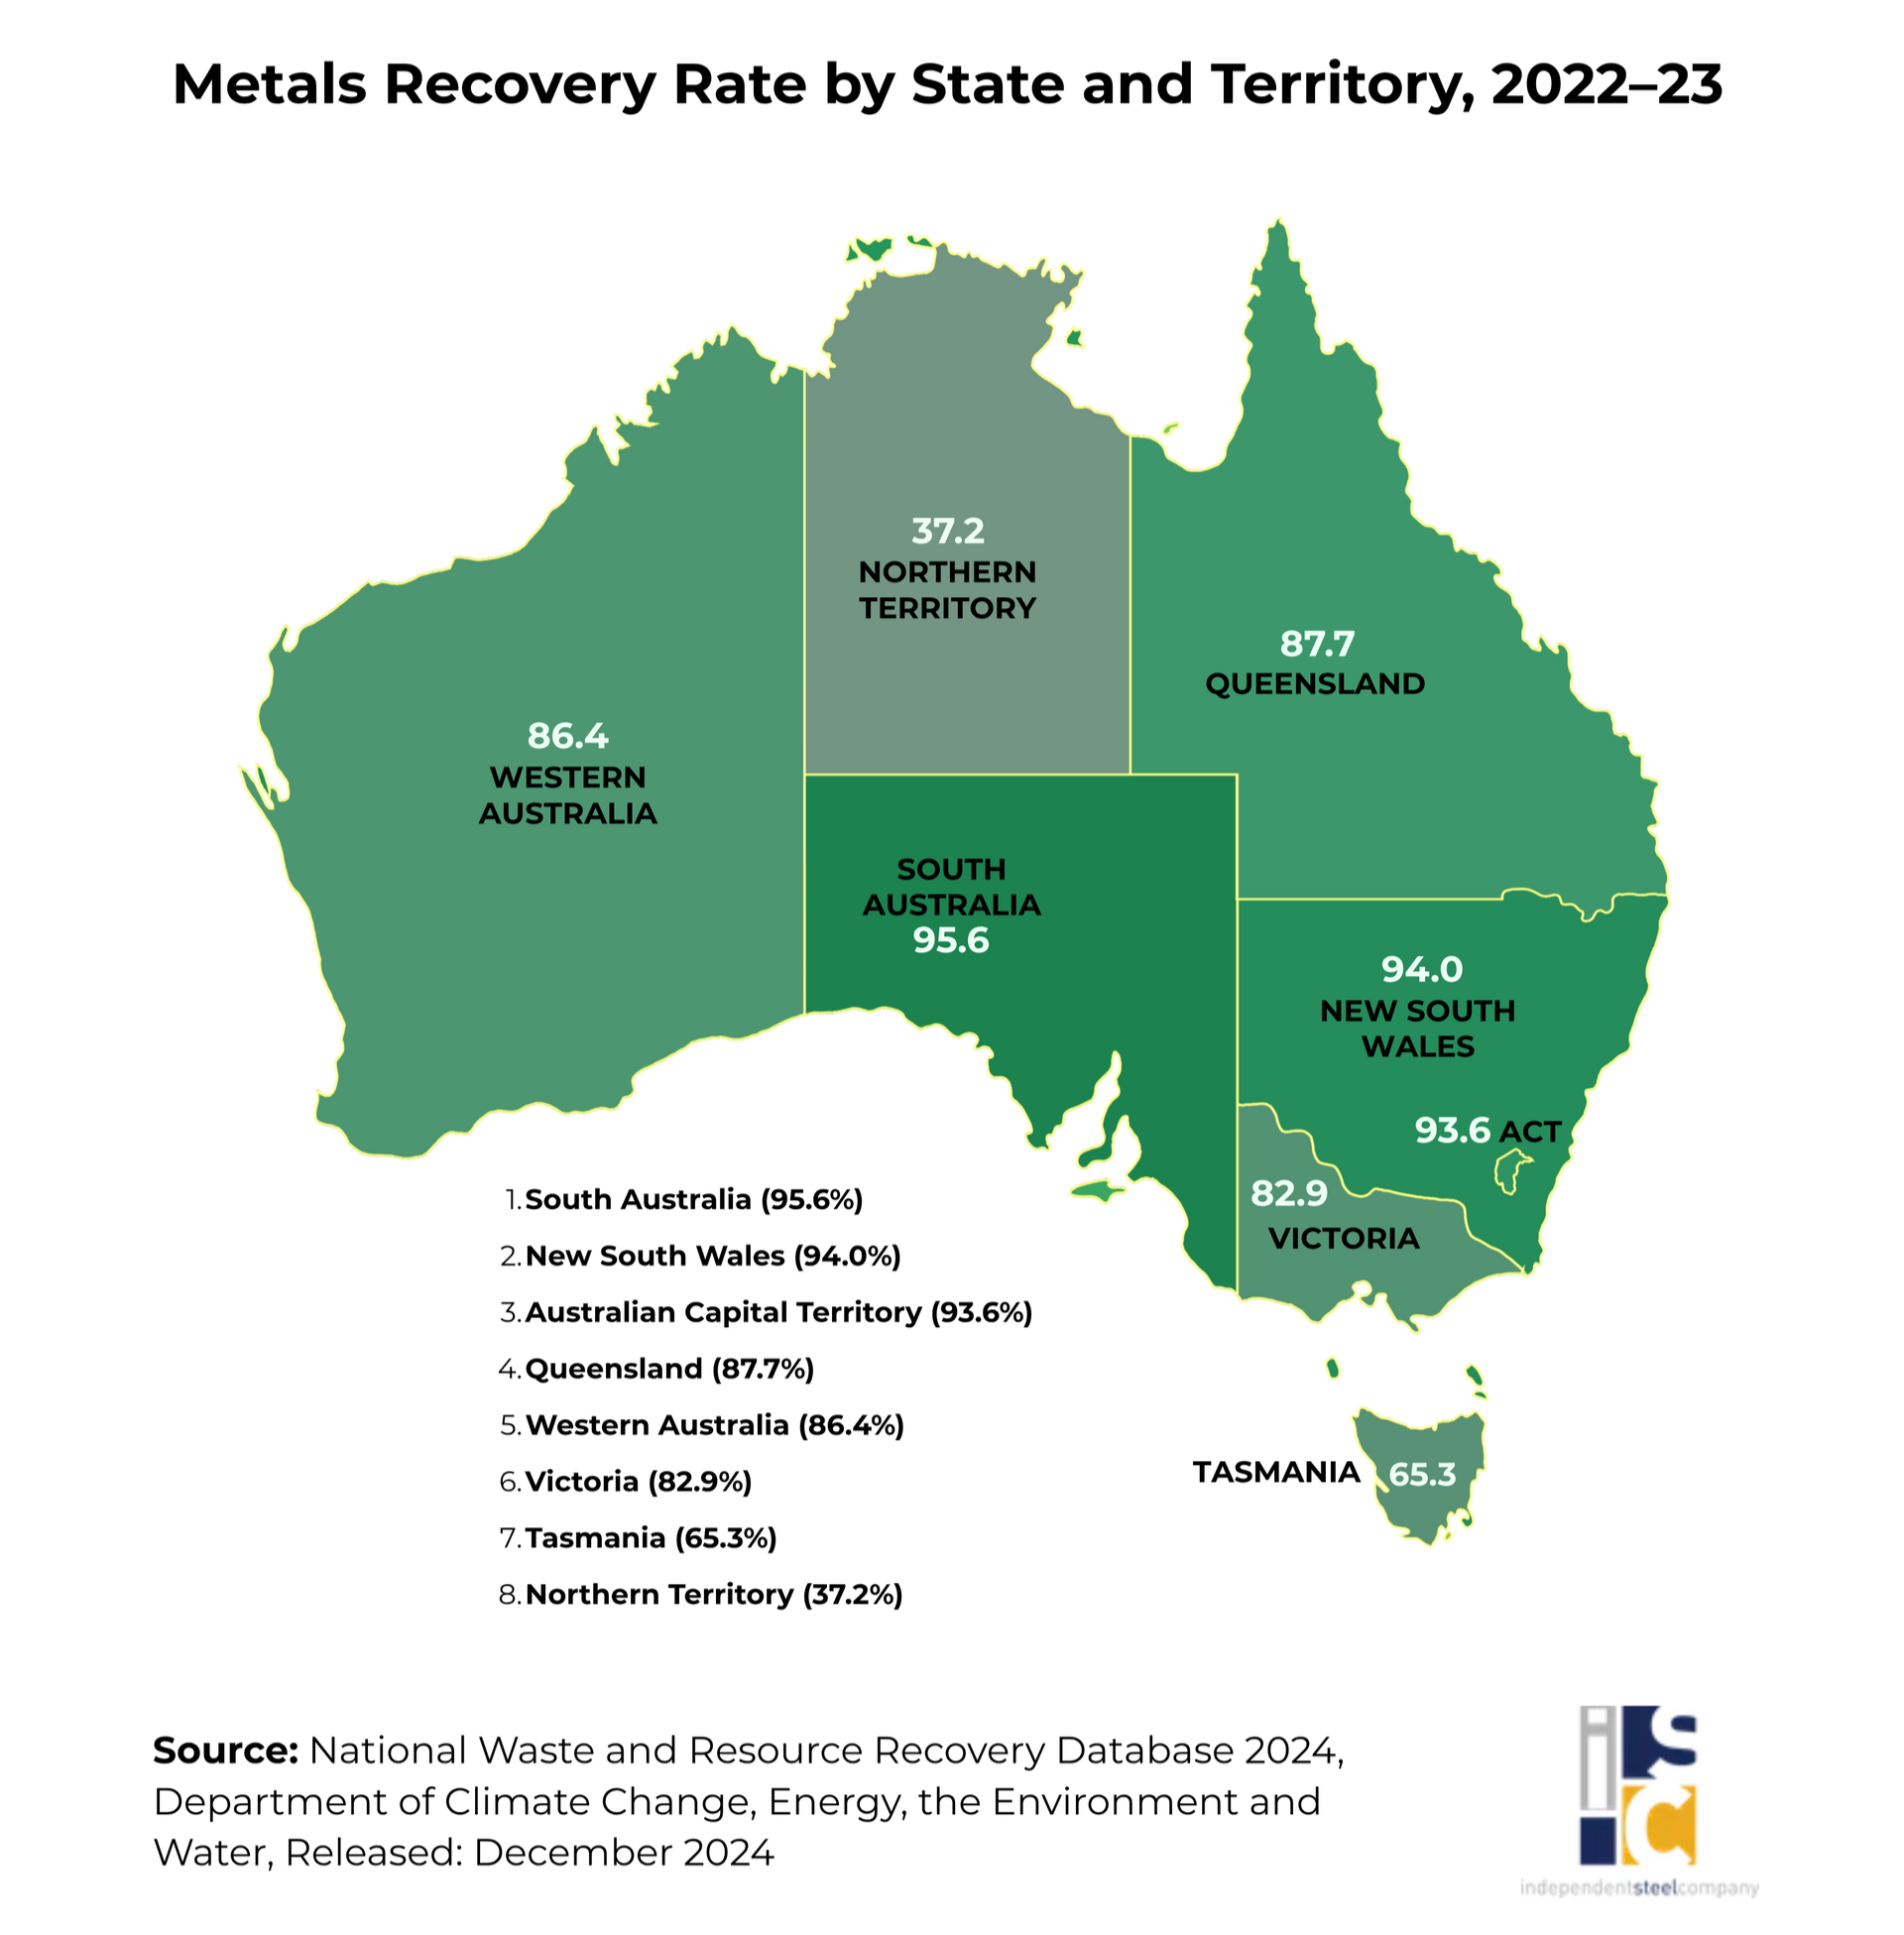
- South Australia (SA) achieved a 95.6% metal-recovery rate in 2022–23, leading the nation for more than a decade.
- New South Wales (NSW) and Australian Capital Territory (ACT) also post over 90% metals recovery rate.
- If all states matched SA, 344,603 additional tonnes of metal could be recovered.
Australia is quietly winning the recycling race, and metals are driving the victory.
New national data shows the country recovered 66% of its 75.6 million tonnes of waste in 2022-23. This is a big leap from under 50 percent in 2006-07.
This data comes from the National Waste and Resource Recovery Database 2024, released by the Department of Climate Change, Energy, the Environment and Water (DCCEEW).
As governments and builders are focused on circular-economy goals and recycled-content rules, this recovery milestone matters more than ever.
But one category stands out far above the rest.
Metals: Australia’s 90% Recycling Powerhouse
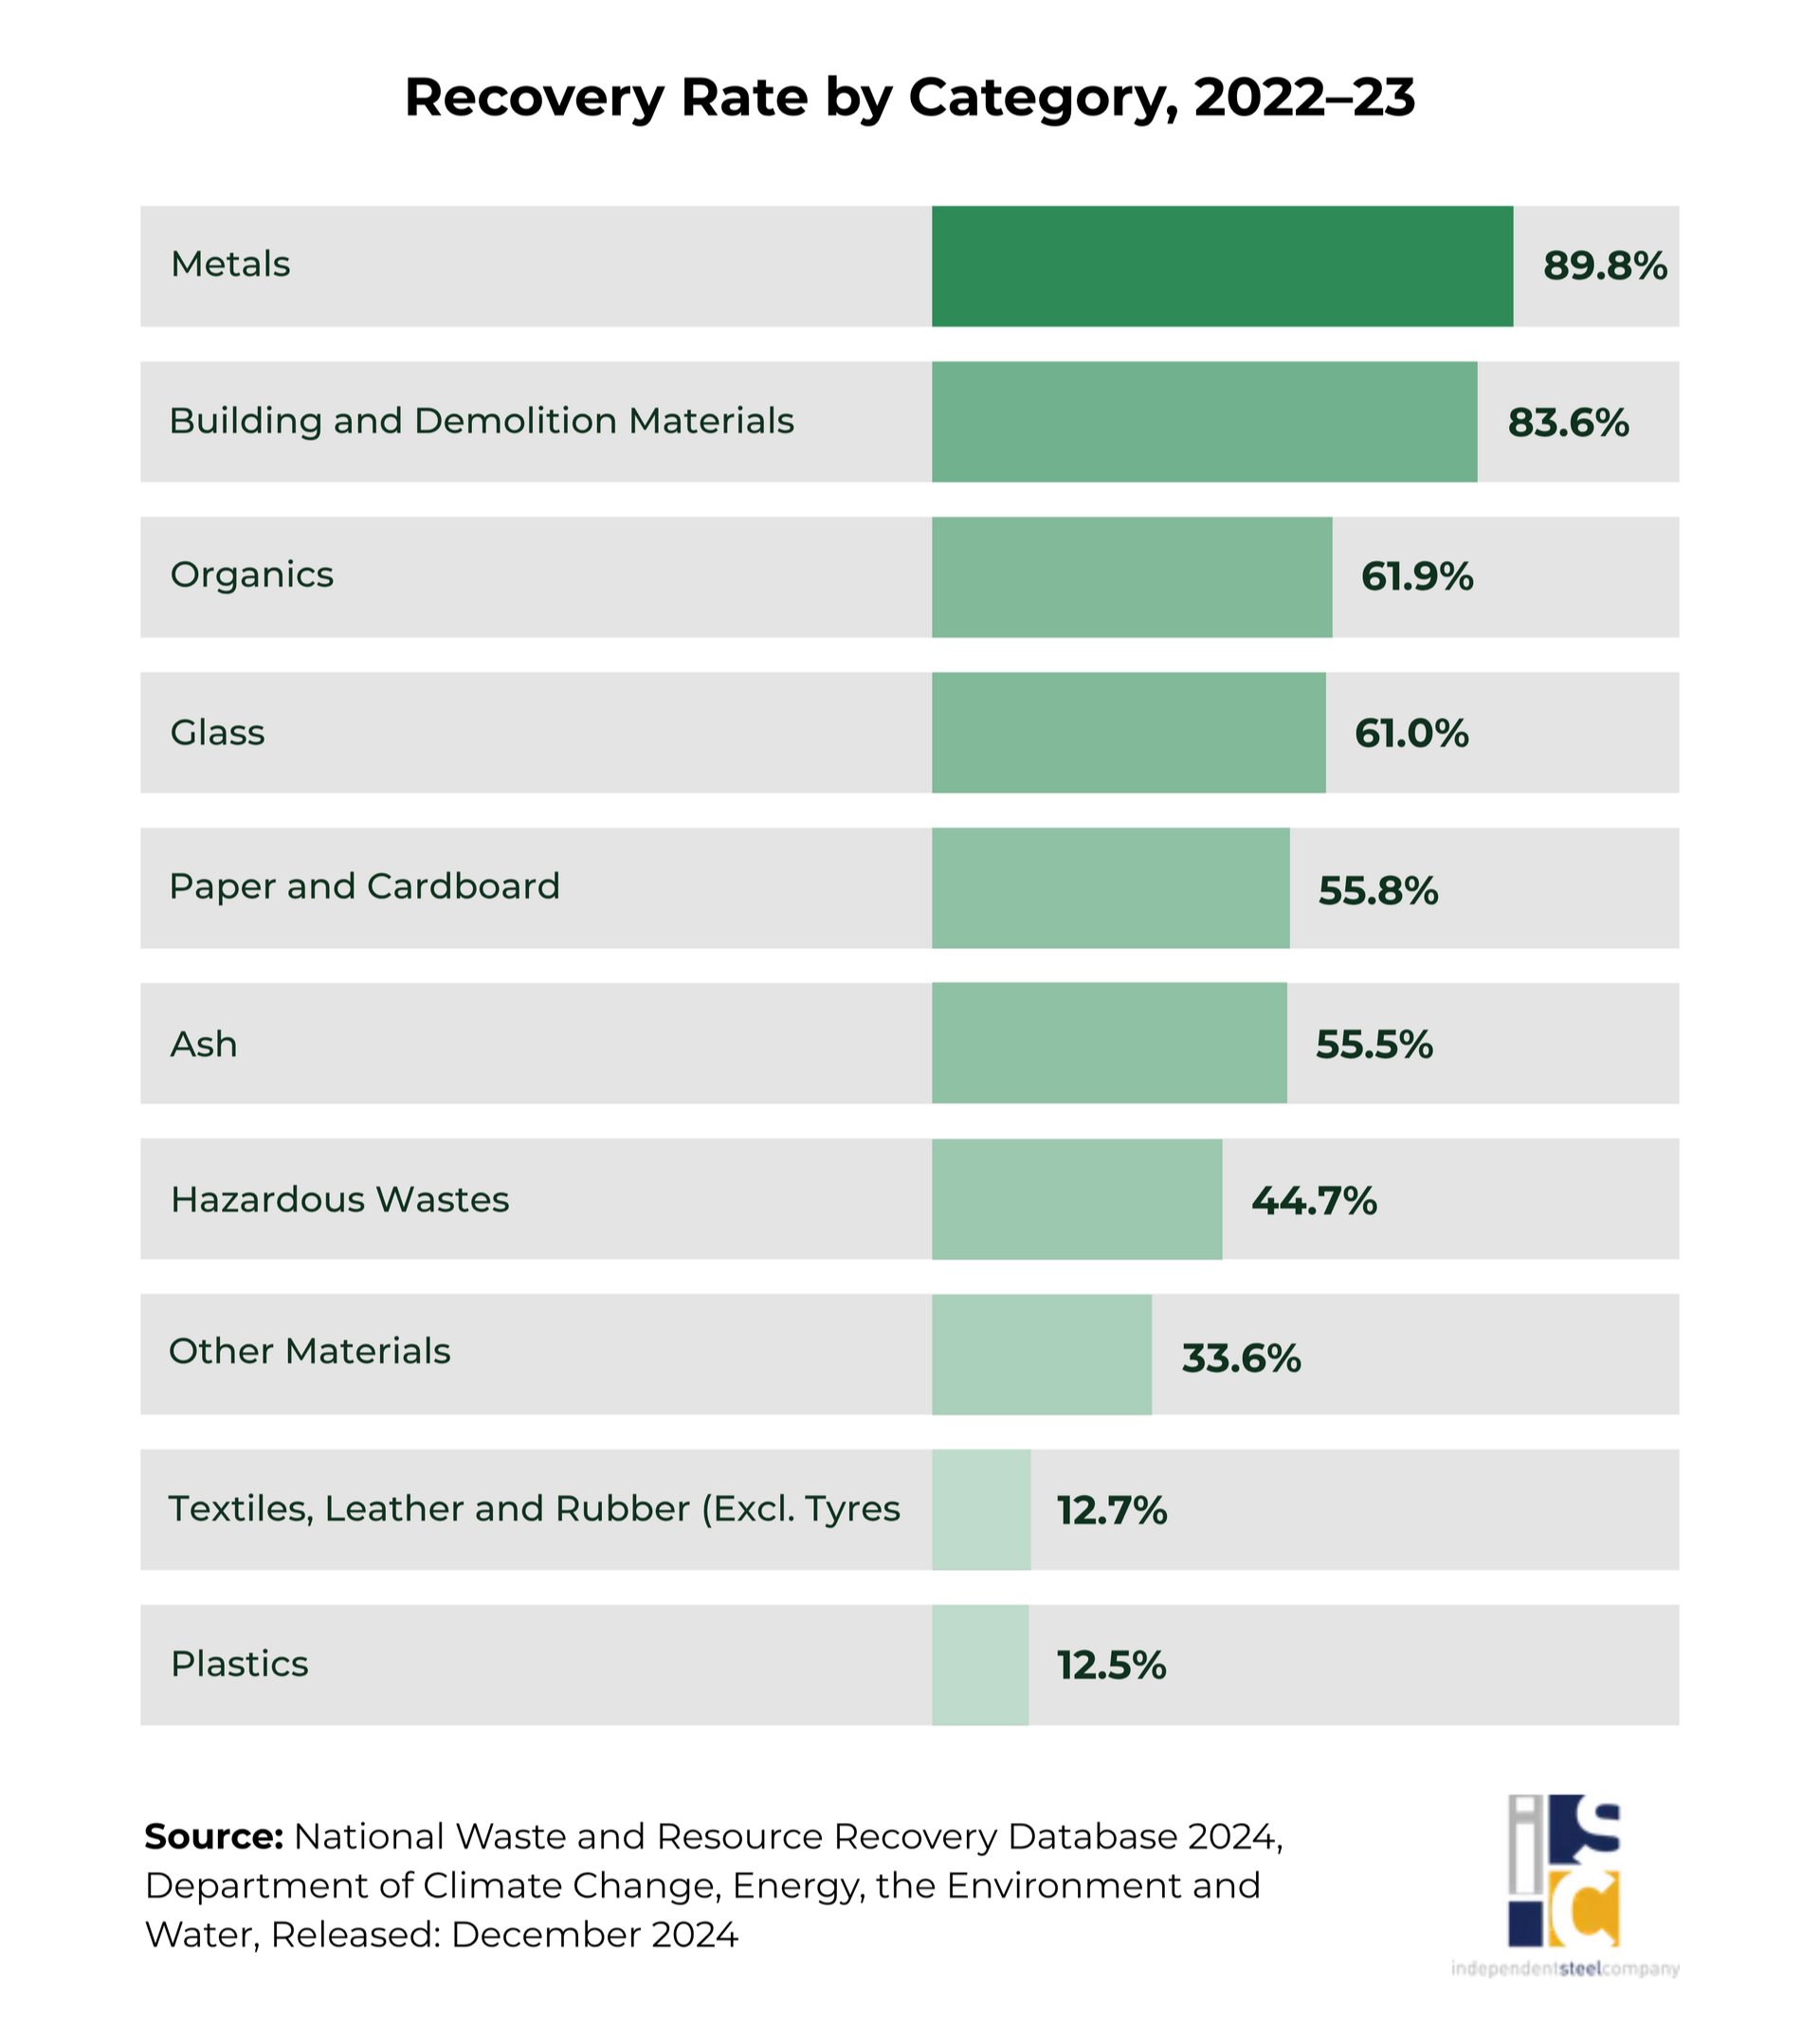
Metals are the undisputed leaders of Australia’s recycling story.
In 2022-23,
nine in ten tonnes of metal waste were recovered, making metals the
most successfully recovered material in the country.
This 90% recovery rate isn’t just a number. It represents a highly efficient industrial network, including scrap collectors, processors, mills, and manufacturers. Together, they form the backbone of Australia’s circular economy.
Why Metals Are Winning
The Australian Steel Institute says the reason behind metals being better than other materials because they can be recycled endlessly while maintaining their strength and quality. Unlike plastics or paper, steel doesn’t degrade with each cycle, it can be melted down and reused again and again without loss of performance. This makes metals inherently circular and highly efficient to recover.
They have lasting economic value and achieve some of the highest recovery rates for any material. This is due to their strong commodity worth and well-established scrap markets (National Waste Report, 2022).
In other words, metal recycling works because it makes both environmental and economic sense.
Where Recycling is Working — and Where It Isn’t

In 2022–23, metal recovery about 95% from Construction & Demolition and almost 93% from Commercial & Industrial streams. In contrast, it was 72% from Municipal Solid Waste. The gap shows cleaner, more focused material flows and strong scrap markets in the industry. In contrast, household metals are scattered and often contaminated.
To improve municipal results, prioritize better source separation. Offer easy drop-off options for bulky metal. Also, ensure clear education for residents, backed by consistent pricing.
Regional Recovery Leaders: South Australia Sets the National Benchmark
When it comes to metal recovery,
South Australia (SA)
continues to lead.
The state hit a
95.6% metal recovery rate in 2022–23, followed closely by
New South Wales (NSW)
and the
Australian Capital Territory (ACT), both above 90%.
SA’s leadership isn’t new. Their metal recovery rate has remained strong for more than a decade.
South Australia’s 95.6% metal-recovery rate comes down to consistency. The state has a strong waste policy. They have reliable local infrastructure and a circular-economy mindset. This approach treats scrap as a resource, not as waste (South Australia Waste Strategy 2020–2025, Government of South Australia, Green Industries SA, 2020).
Their Container Deposit Scheme started in 1977. It set up one of the best material-collection systems in the country. 86% of recovered materials are processed within South Australia. This is thanks to ongoing investment in local reprocessing facilities and strong landfill fees. This reinforces its status as the country's leader in recycling and resource recovery.
Most other states and territories have also improved or held steady, especially NSW, ACT, QLD and WA.
Victoria’s metal-recovery rate is the only exception; it has trended downward across the last four reporting cycles.
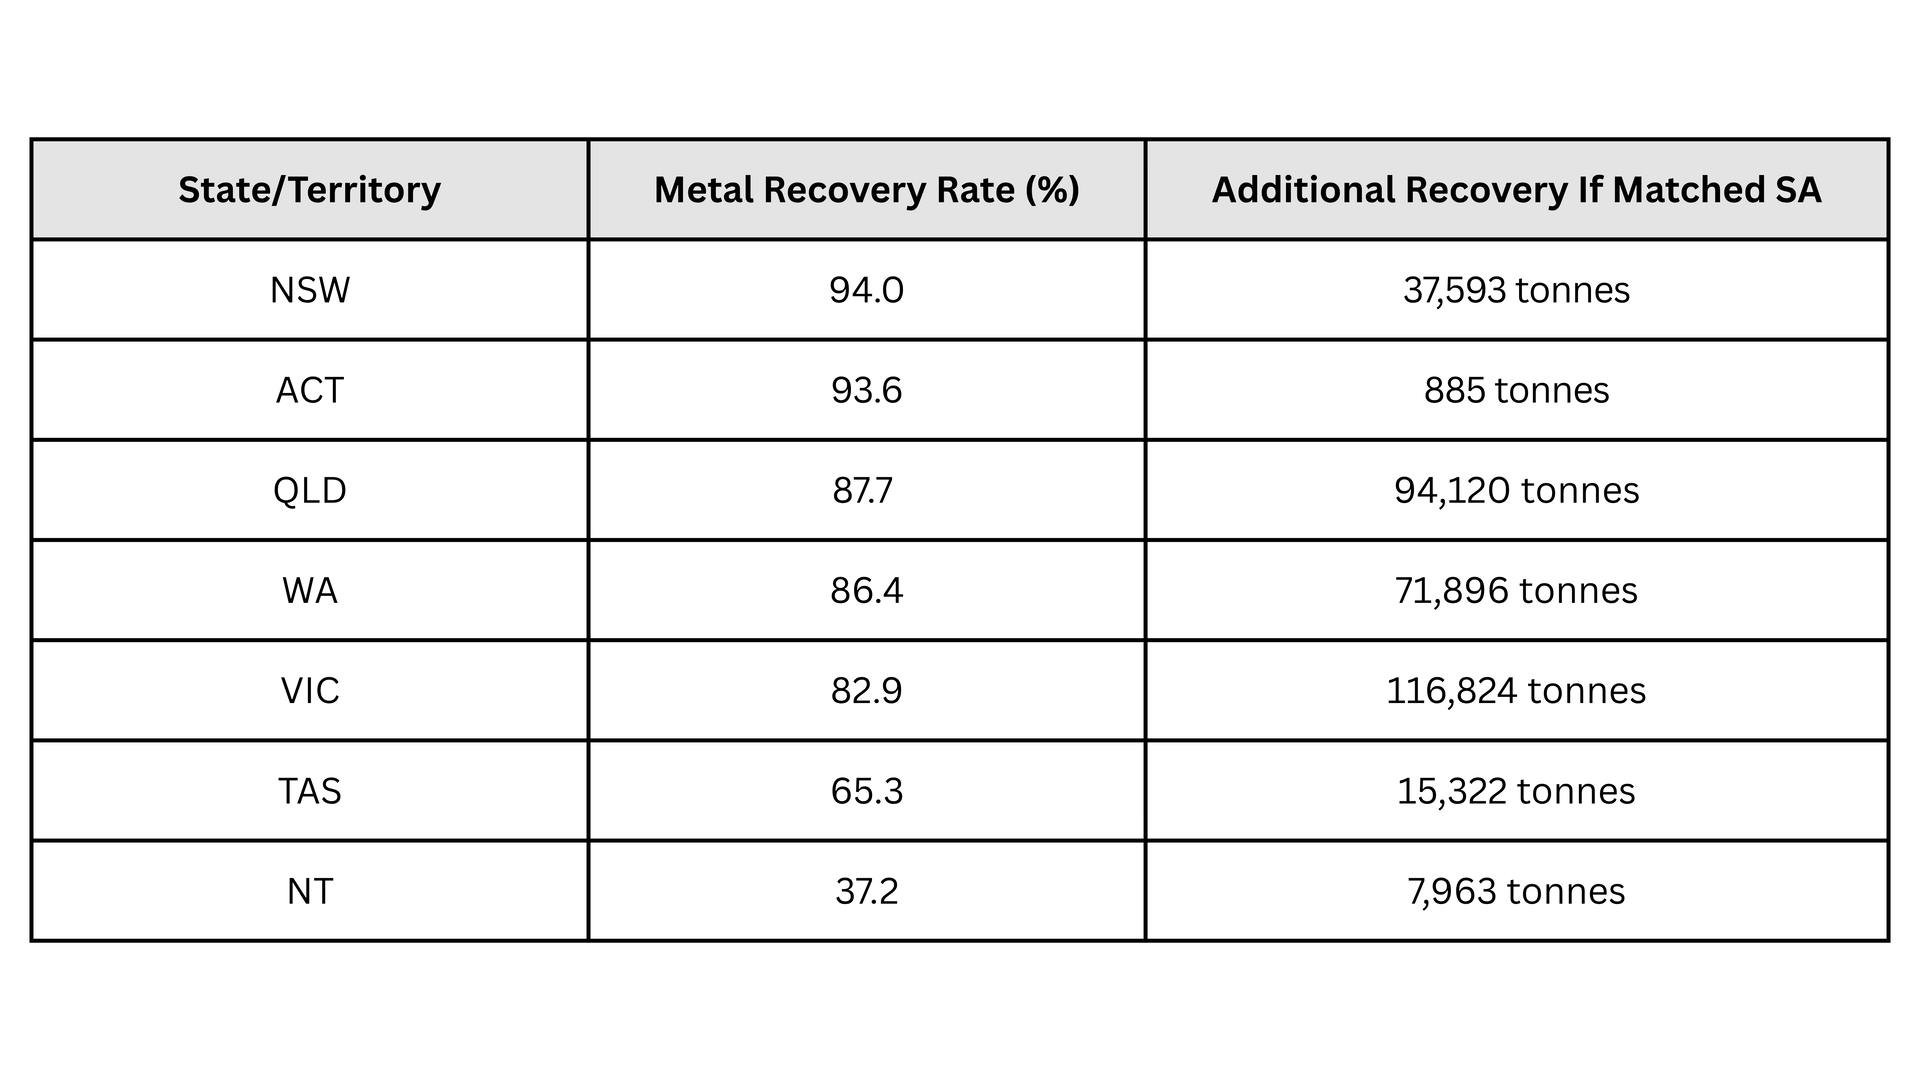
If all states matched SA’s rate, Australia could have recovered an extra 344,603 tonnes of metal in 2022–23.
Closing the Gap
But there’s still work to do: Tasmania (65%) and the Northern Territory (37%) lag far behind national averages.
Bridging this gap could recover hundreds of thousands of tonnes of metal each year. This keeps Australian scrap in a closed-loop system. It powers new infrastructure and cuts emissions from mining and raw steelmaking.
To meet the national goal of an 80% resource recovery rate from waste by 2030 (NATIONAL WASTE POLICY ACTION PLAN 2024, DCCEEW), we need teamwork. Government, industry, and communities must work together. This way, materials can be safely recovered, reused, and stay in the economy longer.
Methodology & Notes on DatA
Primary Data Source - National Waste and Resource Recovery Database 2024, Department of Climate Change, Energy, the Environment and Water, Released: December 2024
Note –
1. Financial year. The database covers the years 2006-07 to 2022-23, except 2007-08, 2011-12 and 2012-13.
2. The headline scope of waste reporting, as defined in the Australian standard for waste and resource recovery data and reporting (second edition), is 'core waste plus ash'.
3. Recovery rate = ((recycling + energy recovery + waste reuse) ÷ total waste generated) *100
4. Waste generated = recovered + Disposed
4. Figures rounded
5. Source stream - Either municipal solid waste (MSW), commercial and industrial (C&I) waste or construction and demolition (C&D) waste.
6. Estimate what each state could recover if it matched SA’s rate:
target recovered total = SA recovery rate × total waste generated of state
Other Data Source
1. https://www.steel.org.au/what-we-do/focus-areas/sustainability/reduce-reuse-and-recycle/
2. National Waste Report 2022, The Department of Climate Change, Energy, the Environment and Water (Please verify again the name)
3. SUPPORTING THE CIRCULAR ECONOMY, SOUTH AUSTRALIA’S WASTE STRATEGY 2020-2025, Government of South Australia, Green Industries SA, 2020
4. NATIONAL WASTE POLICY ACTION PLAN 2024, DCCEEW
About Independent Steel Company
Independent Steel Company is a family-owned steel supplier with branches in Queanbeyan, Moss Vale and Nowra. We keep local builders, farmers and fabricators moving with reliable stock and fast service.
Fair Use Statement
The information in this article may be used for noncommercial purposes only. When sharing, please link back to Independent Steel Company for proper attribution.